

Within the United States, most people believe that the reason our schools are failing is that schools are underfunded. They believe what the media and teachers have been peddling for years, “teachers are overworked and underpaid.” But is that true? Is school performance directly correlated with per student spending?
Trying to track down the real cost
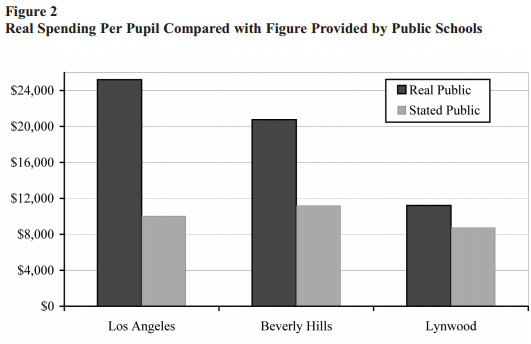
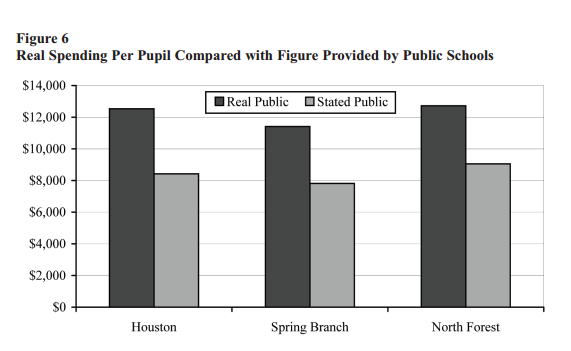
A difficult aspect of answering this question is that public school officials constantly lie about how much money they’re getting in. In a study done by the Cato Institute, it was found that some school districts underrepresented the amount spent on students by as much as 90 percent.
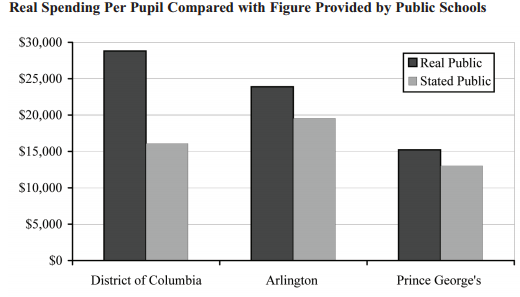
in third place for average real spending in our study. The average real per-pupil spending figure of $19,000 is a stunning 90 percent higher than the $10,000 the districts claim to
spend. In addition, real public school spending is 127 percent higher than the estimated median private school spending of $8,400.
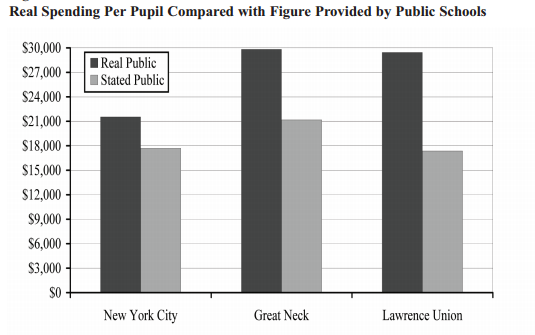
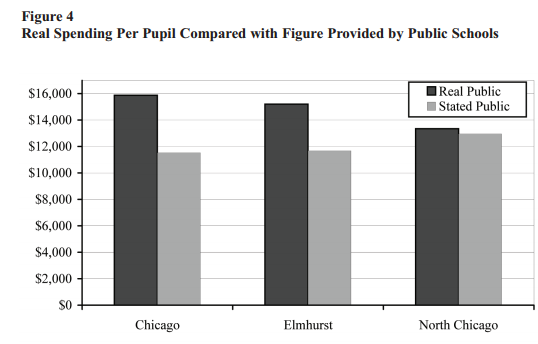
That same discrepancy was found in every other state checked. Here are just a few examples:
Public K–12 education consumes a larger chunk of each state and local taxpayer dollar than any other expense. More than one out of four tax dollars collected goes to the government-run K–12 education system. However, despite the importance of educating children and the huge expense it currently entails, there is a troubling lack of transparency in school budgets.
Alright, it costs a lot, but isn’t it worth it?
The assumption is that schools need to spend this amount of money, because it costs a lot to educate children. I mean, private schools are just as expensive, right?
As Stephen Fry put it, “the short answer to your question is “no”. The long answer to your question is “f*ck no”.
The average cost for a private elementary school student is $7,700 dollars, while the average public school cost is $25,000 dollars per student.
What about kids with special needs?
Yet another assumption is that children with special needs cannot be helped in private schools as much as they are in public schools. A fantastic write up regarding an experiment in Florida works to disprove this claim.
As reported by the Washington Times:
“Consider Florida’s McKay Scholarship program, which allows parents to pull their special-needs children out of the public schools and place them in private schools of their choosing. Parental satisfaction with McKay is stratospheric, the program serves twice as many children with disabilities as the D.C. public schools do, and the average scholarship offered in 2006-’07 was just $7,206. The biggest scholarship awarded was $21,907 — still less than the average per-pupil spending in D.C. public schools.”
More money does not equal better results
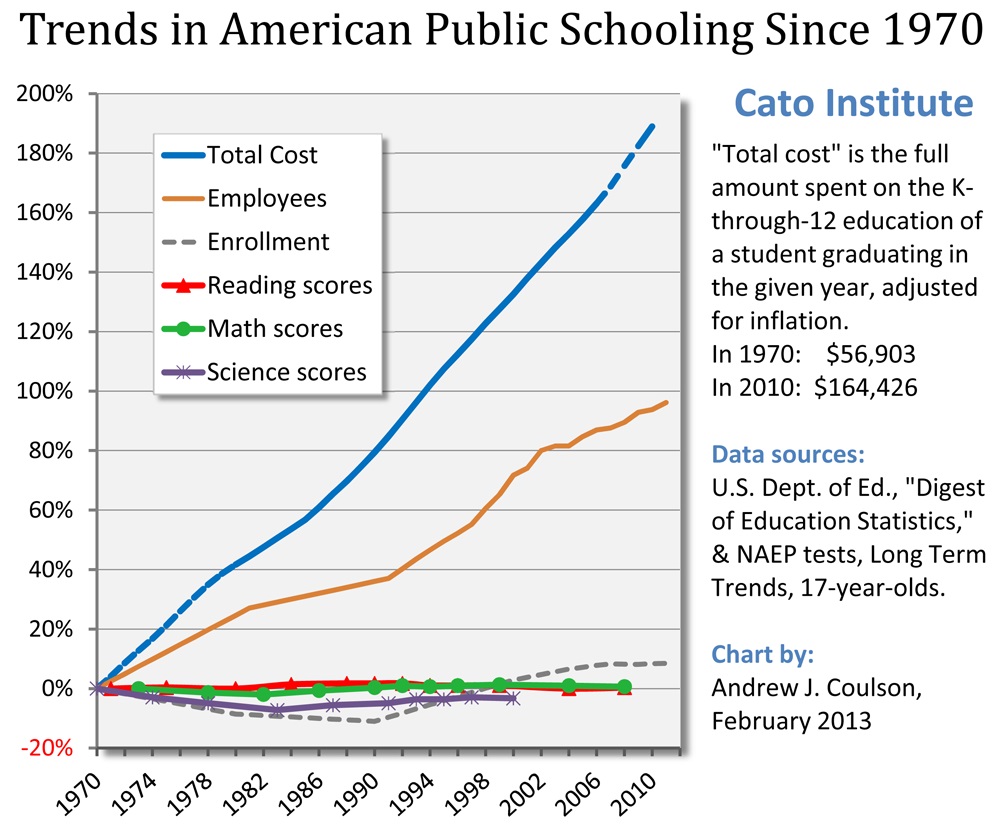
Take a look at the graphs above, and now tell me that the reason schools are doing badly is because of a lack of funding.
The achievement data come from the Department of Education’s own National Assessment of Educational Progress “Long Term Trends” series, which regularly tests nationally representative samples of U.S. students, drawing from the same pool of questions in use since the tests were first administered around 1970. These are the best data we have on what our kids know by the end of high school and how much it has cost to get them there.
The truth of the matter is, schools are more analogous to prisons than educational centers.
For just one last graph, let’s take a look at how public school children – with their vast amount of specialized teachers – do against home educated children.
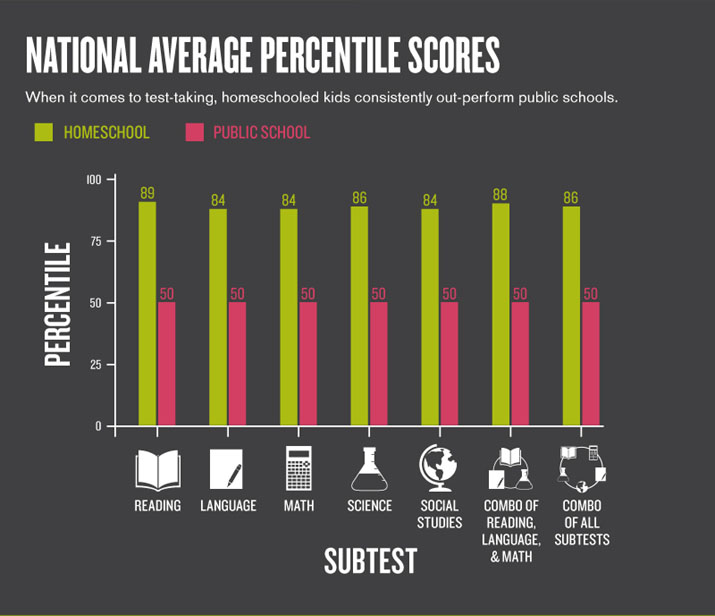
So schools are lying about how much they spend, the spending has no correlation with positive outcomes, and public school students do much worse than home educated students on all subjects. Still think we need to increase funding for public education?
If you’re thinking of getting your child out of public school, or simply need a little help with your homeschooling/unschooling curriculum, consider checking out the Ron Paul Homeschool Curriculum.
Tell us in the comments section what you think
Follow us on Twitter and Facebook
 About the writer: Carlos Morales is a the author of “Legally Kidnapped: The Case Against Child Protective Services“, president and founder of CPS Victim Support, the host of the Libertarian Atheist Podcast, and a committed legal advocate for family reunification.

Hospital Won’t Allow Father to Donate Kidney to Dying 2-Year-Old Son Because of Gun Arrest


I’m not quite clear on whether your spending numbers are adjusted for inflation? I’d share this elsewhere but it doesn’t quite make sense yet. Also, what are the statistics on high-school dropouts? We may be currently testing students who in the 70’s and 80’s would have already typically dropped out, making theses statistics difficult to compare over time. It’s all food for thought. Thank you.
Not saying I disagree with anything here, in fact I agree. But that final chart is interesting. Not really sure what I’m looking at, but find it odd that public schools are exactly 50% across the board. Is there a link or article or study that explains that chart?
No explanation as to why the numbers are allegedly higher.. Why are they higher? Sources?